

02.1 · Layer Coverage
/ 3-Layer
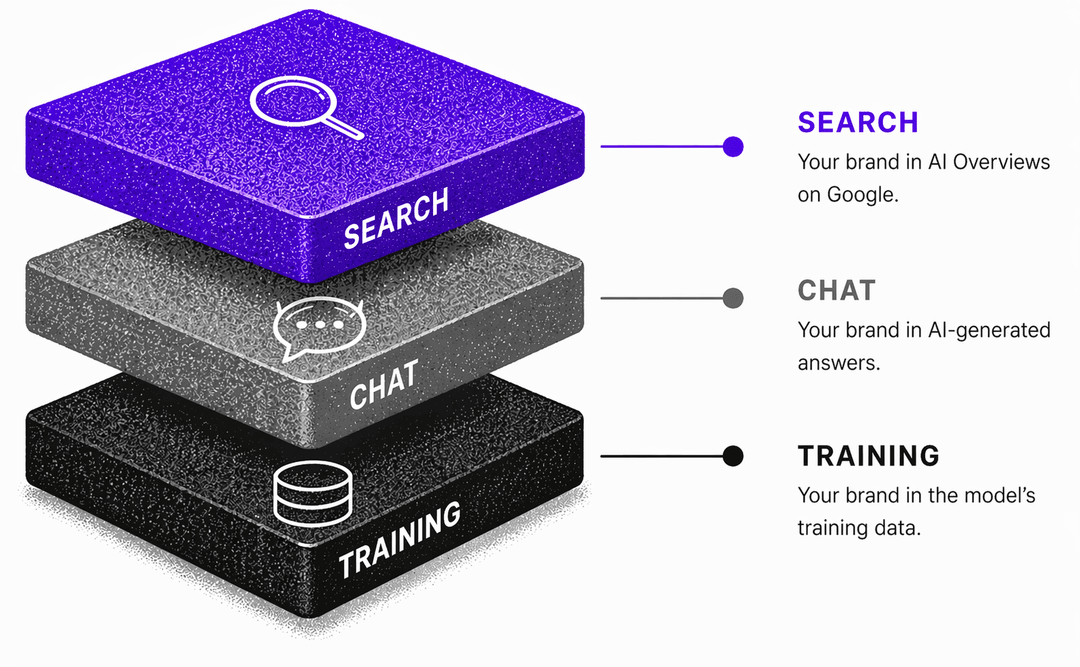
The full AI stack.
Your brand lives in three layers inside AI: the training data, the chat answers, and the AI Overviews in Google. Each layer has its own rules. RAIDAR measures all three — so you can discover optimal opportunities everywhere.
Three Layers · Share of Answers
Decision
Know whether to invest in training-data influence, chat presence, or search-moment optimization — instead of spraying budget across all three.